Detect Android Memory Leaks in Production | Appxiom
Detect memory leaks in Android apps running in production. Appxiom helps teams find and fix memory issues that affect performance and user experience.
Detecting and fixing Memory Leaks in Android apps, in release mode
Memory leak in live apps
What is Memory Leak in Android apps?
A memory leak in an Android app is a common issue that occurs when an app fails to release memory that is no longer needed. This causes the app to consume more and more memory over time, which can lead to degraded performance and crashes. Memory leaks are a serious issue for Android apps as they can negatively impact user experience and should be addressed by developers to ensure the app runs smoothly.
In general, memory leaks occur when there is a programming error that causes an app to retain references to objects that are no longer needed, preventing them from being garbage collected. This can happen when developers do not properly manage object references or use too many resources without releasing them. Memory leaks can also occur when improper use of static variables cause objects to remain in memory even after they are no longer required.
Detecting and fixing memory leaks can be a challenging task. It requires a thorough understanding of the app's memory usage and the ability to identify and isolate the root cause of the leak. Fortunately, there are tools available to help developers identify memory leaks, such as Android Studio's Memory Profiler. It is important for developers to follow best practices for managing memory and to be diligent in testing and debugging to ensure that memory leaks are caught and fixed before they impact the app's performance or user experience.
Reasons for Memory Leak in Android apps in release mode
There are several reasons for memory leaks in Android applications in release mode, including:
Incorrect management of object references, where objects are not released when they are no longer needed. This can happen when developers do not properly manage their object references, leading to the retention of objects in memory even when they are no longer necessary. This can occur when objects are not explicitly released, or when there are circular references that prevent objects from being garbage collected.
Improper use of static variables, which can cause objects to remain in memory even after they are no longer required. Static variables are allocated when the application is loaded and are retained in memory until the application is closed. If static variables are not properly managed, they can lead to memory leaks and degrade application performance over time.
Using too many resources without releasing them, such as bitmaps, cursors, or file streams. Android applications often use a significant amount of resources, such as images or files, which can lead to memory leaks if they are not properly released. Developers must ensure that all resources are properly released when they are no longer needed to prevent memory leaks.
Memory leaks can significantly impact application performance and user experience. It is important for developers to follow best practices for managing memory, such as avoiding circular references, properly managing static variables, and releasing resources when they are no longer needed. By doing so, developers can prevent memory leaks and ensure that their applications run smoothly and efficiently.
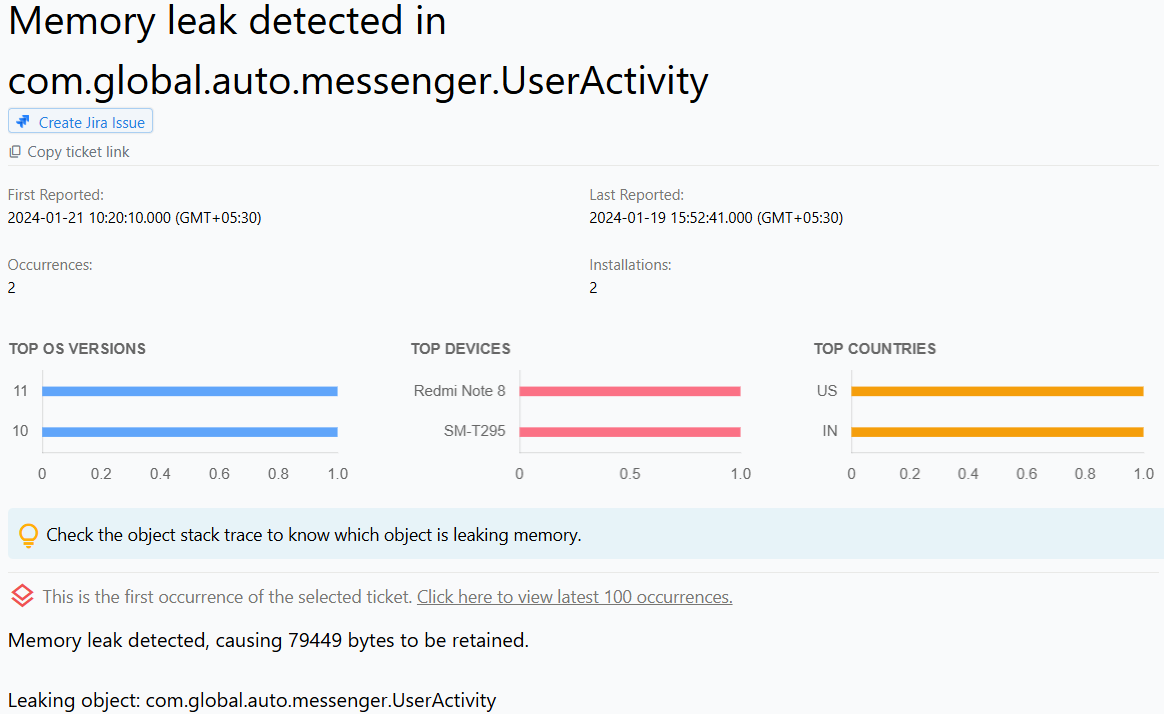
How do we use the information in the screenshot to fix Memory Leaks in Android apps in release mode?
Issue report provides name of the activity where the leak occurred and an activity trail. Activity trail, which is a chronologically ordered list of events that occurred prior to this issue, allows developers to follow the events that lead up to the memory leak issue. Following the activity trail will allow developers to use the debug flavor of Appxiom SDK to identify the exact object causing the leak.
How Appxiom Detects Memory Leaks
Appxiom automatically detects memory leaks in Android applications by monitoring memory usage patterns and tracking activity lifecycles. When a memory leak is detected, Appxiom provides detailed information including:
- Activity Name: The specific activity where the leak occurred
- Activity Trail: A chronologically ordered list of events that led to the memory leak
- Memory Usage Data: Current memory consumption and growth patterns
Activity Trail Feature
The activity trail is a key feature that helps developers understand how the memory leak occurred. It provides:
- Event Sequence: Step-by-step events leading to the leak
- Timeline: When each event occurred
- Context Information: What was happening in the app at each step
This allows developers to follow the exact sequence of events that caused the memory leak, making it easier to identify and fix the root cause.
Using Debug Flavor for Detailed Analysis
Following the activity trail allows developers to use the debug flavor of Appxiom SDK to identify the exact object causing the leak. The debug version provides additional diagnostic information to pinpoint the specific code or object responsible for the memory leak.
Conclusion
Appxiom's memory leak detection combines automatic monitoring with detailed reporting to help developers quickly identify and fix memory issues in their Android applications. The activity trail feature provides the context needed to understand how memory leaks occur, making the debugging process more efficient.
For more information about Appxiom's memory leak detection capabilities, contact our team for a detailed consultation.