Understand the Business Impact of Issues in Your App
Appxiom detects crashes, ANRs, app hangs, memory leaks, performance issues, and many more - giving you complete visibility of how each bug impacts user experience, conversions and revenue. Focus on what truly matters, and turn issues into opportunities for growth.
Why fixing bugs isn't enough
Fixing bugs keeps your app running. But fixing the right bugs keeps your business growing. Most tools stop at error reports - Appxiom shows you the real impact on users, conversions, and revenue.
Why Bugs Hurt Your Business
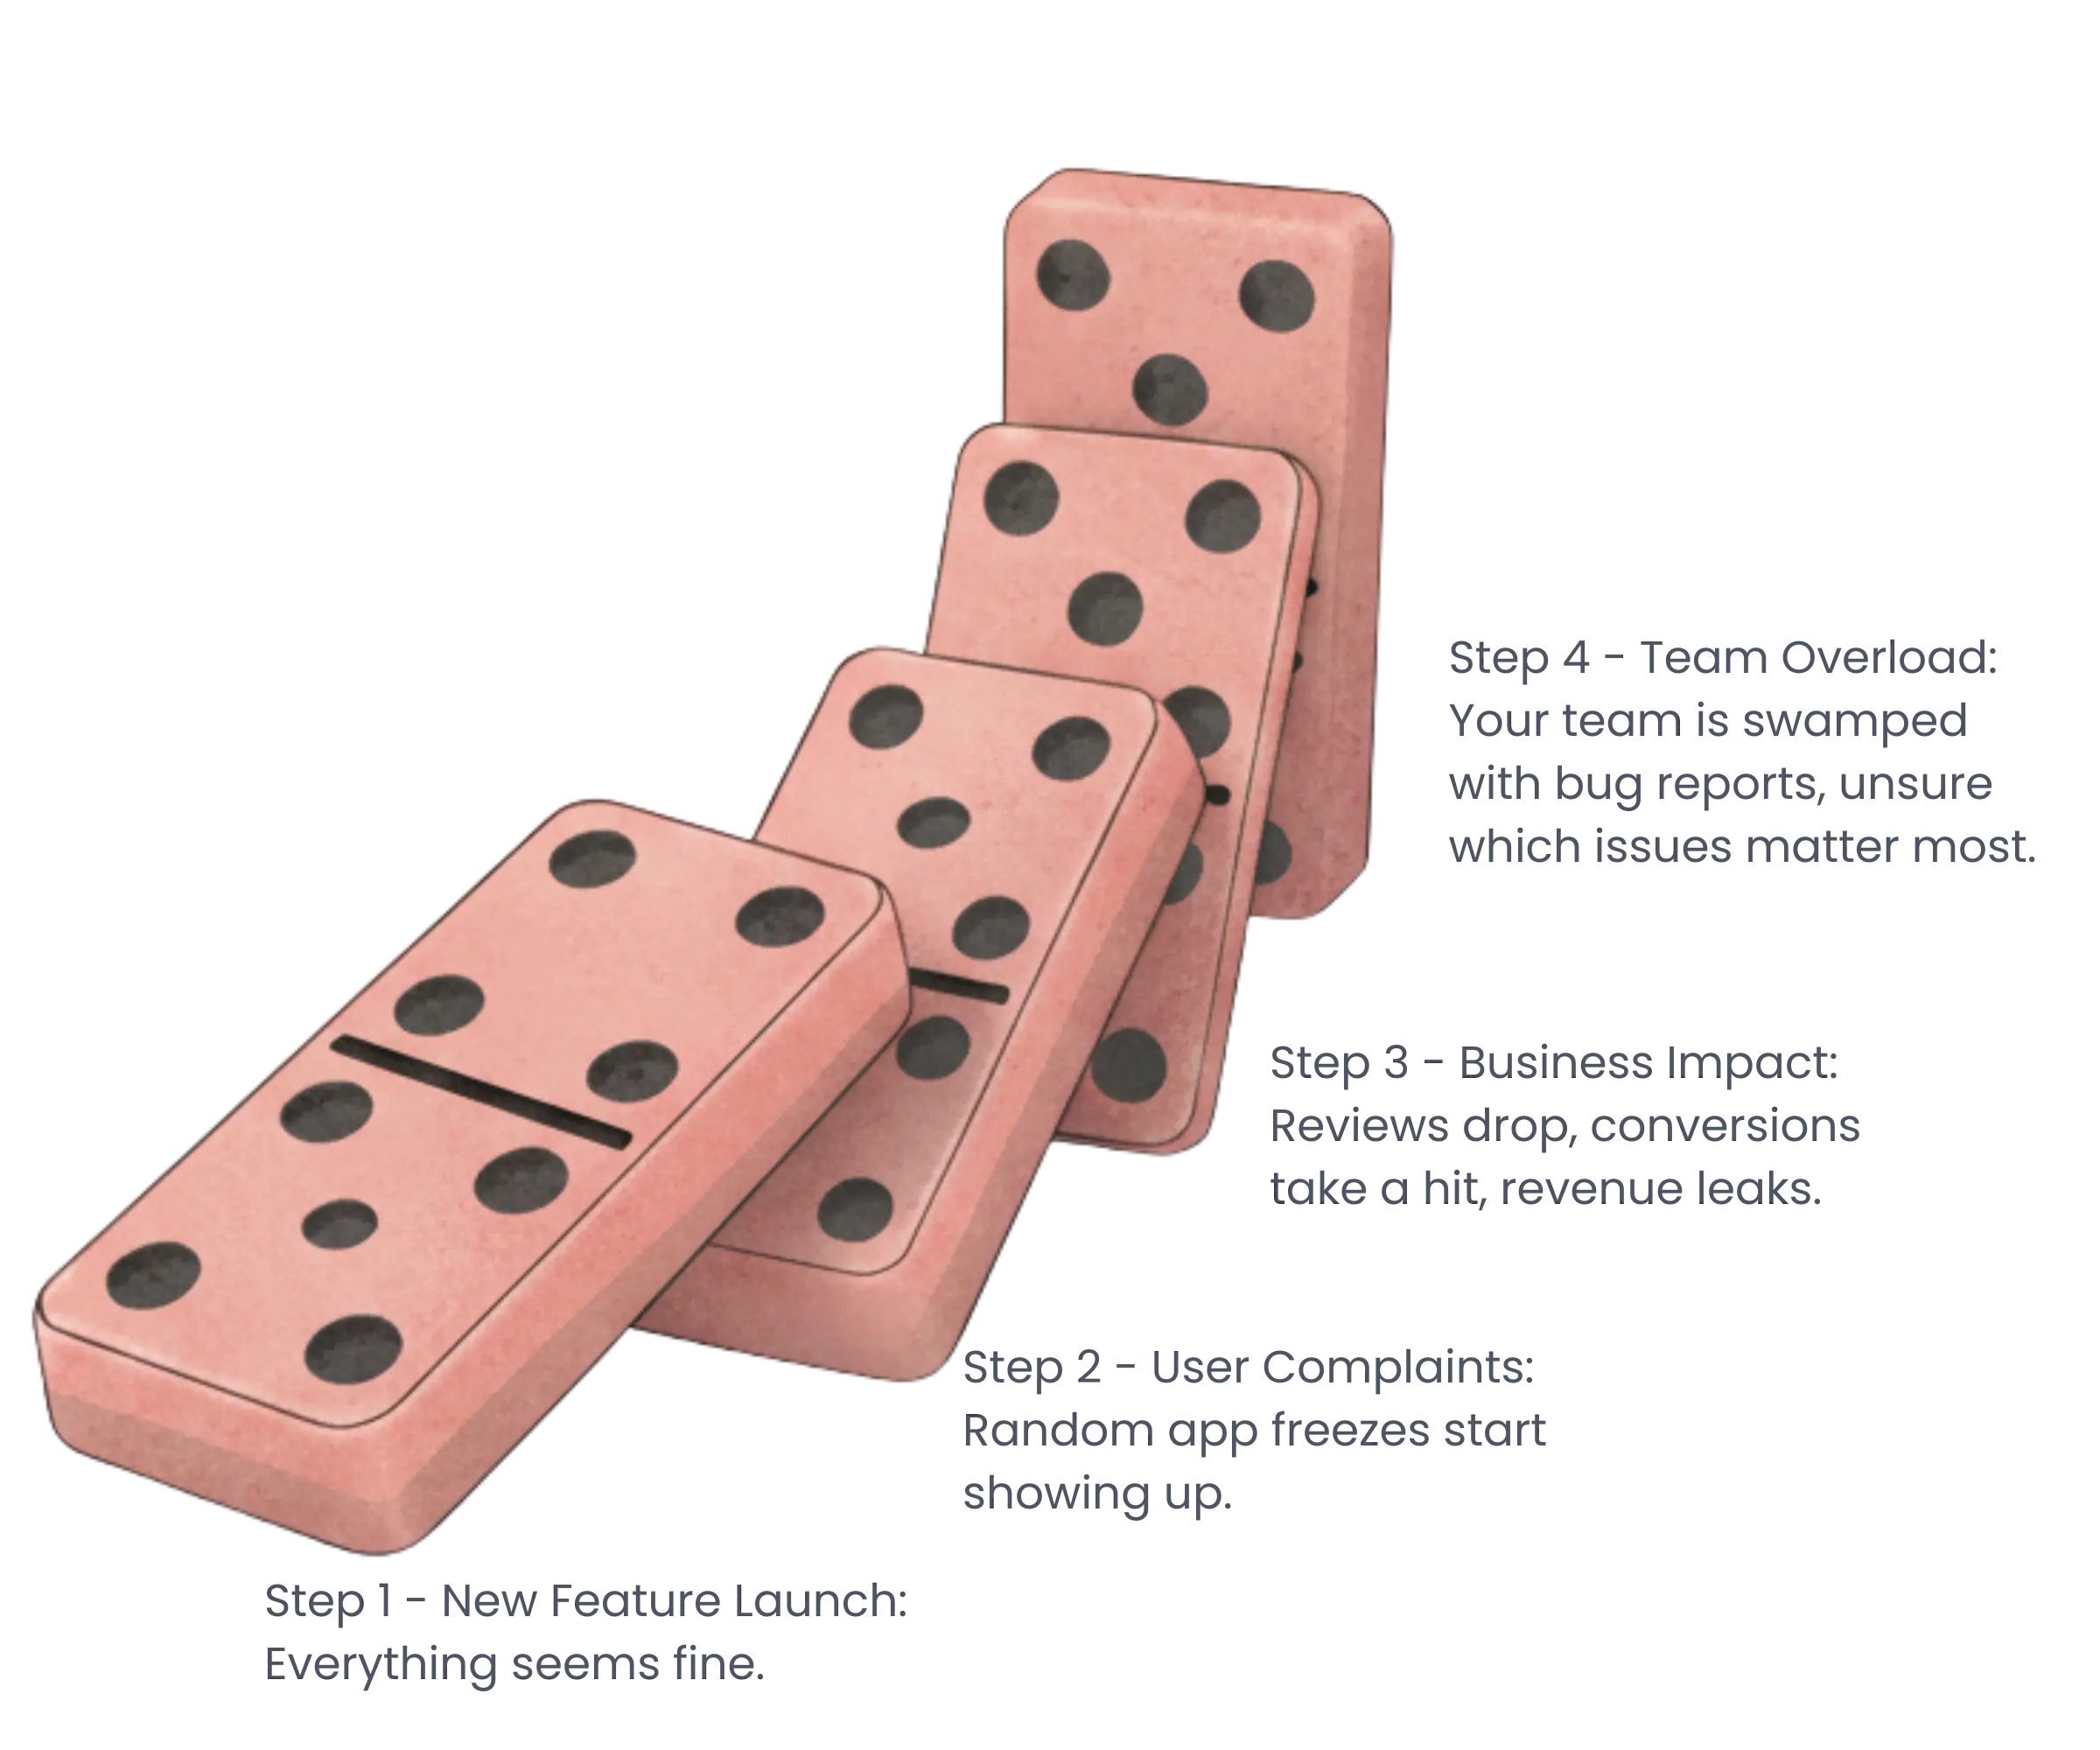
Imagine this: You launch a new feature, and everything seems fine… until users start complaining about random app freezes. Reviews start dropping, conversions take a hit, and revenue leaks quietly in the background. Your team is swamped with bug reports, but it’s impossible to know which issues really matter.
Stop Guessing. Start Fixing
Imagine no longer drowning in endless bug reports. With Appxiom, you automatically detect crashes, ANRs, app hangs, performance issues, and many more hidden problems that silently hurt your business. You get clear, actionable insights, so your team can fix what truly matters first. The result? Happier users, smoother apps, and revenue that keeps flowing.
How Appxiom Helps You Fix Them
See how bugs block critical user goals like signup, login, or purchase.
Track overall app health with a simple 0–10 score everyone understands.
Compare installs, crashes, and stability across releases to know which versions drive success.
Comprehensive Bug Detection
Appxiom monitors all critical bug types across iOS, Android, and Flutter platforms. Each bug type is analyzed for its potential impact on user experience and business goals.
Application Not Responding (ANR)
Detects when your Android app becomes unresponsive, typically when the main thread is blocked for more than 5 seconds.
App Hang
Identifies when your iOS app becomes frozen or unresponsive, affecting user experience and causing frustration.
Memory Leaks
Memory leaks Identifies objects that are not properly released, causing gradual memory consumption increase over time, even in production environments.
Frozen Frames
Monitors frame drops and jank that create stuttering animations and poor visual performance.
App Crashes
Captures fatal errors that cause your app to terminate unexpectedly, including stack traces and crash context.
API Issues
Detects network failures, slow API responses, timeouts, and connectivity problems affecting app functionality.
Custom Issues
Fail conditions that can be anticipated by the developer
Memory Issues
Monitors out-of-memory errors, excessive memory usage, and memory pressure situations.
Screen Load Delays
Tracks slow screen transitions, loading times, and user interface responsiveness issues.
Explore All Issue Types
Dive deeper into our comprehensive issue detection capabilities and see real examples of how each bug type affects user experience.
Fix the Bugs That Block Your Goals
Goal Friction Impact measures how technical bugs disrupt critical user journeys in your app. Instead of just knowing a bug exists, you understand its real business impact.
How It Works
Define User Goals
Set up critical user journeys like sign-up, purchase, or content creation.
Monitor Bug Impact
Track when bugs occur during these critical journeys.
Prioritize Fixes
Focus on bugs that have the highest business impact first.
Example Impact Analysis
Blocking 23% of purchase attempts
Affecting 8% of user conversions
Minor impact on user engagement
Understand Goal Frictions and Its Impacts
See how Appxiom connects app issues to real business outcomes like performance, engagement, and revenue.
One Score to Measure App Health
Quality Score transforms complex app health data into a single, actionable metric. Instead of juggling multiple indicators, get instant insight into your app's reliability and stability across all versions.
How Quality Score Works
Aggregate All Issues
Combine crashes, ANRs, app hangs, memory leaks, performance issues, and user-reported bugs into weighted metrics.
Calculate Impact Score
Apply business impact weighting to prioritize critical issues affecting user experience and revenue.
Generate Unified Score
Produce a 0-10 quality score that's easy to understand, track, and communicate to stakeholders.
Quality Score Breakdown
Excellent stability, minimal crashes, optimized performance
Moderate issues with memory usage and occasional ANRs
High crash rate, critical performance bottlenecks
Unlock Insights from Quality Score
Dive into Quality Score analytics, learn scores of each app version and track improvements.
See the Story Behind Every Release
Version Analytics transforms app release data into strategic insights. Compare installations, bug rates, and stability metrics across all versions to turn every release into a measurable success story.
How Version Analytics Works
Track Installation Metrics
Monitor adoption rates, active installations, and user migration patterns across all app versions.
Compare Stability Data
Analyze crash rates, ANR incidents, memory usage, and performance metrics side-by-side.
Generate Release Insights
Identify which versions succeed, understand why, and replicate success patterns in future releases.
Version Comparison Dashboard
Understand Version Performance at a Glance
Compare app versions, analyze performance trends, and uncover patterns that affect stability and user experience.
Multi-Platform Support
iOS
AvailableAndroid
AvailableFlutter
AvailableWeb
SoonWhy Choose Appxiom?
Appxiom goes beyond traditional debugging tools by not only detecting bugs but also revealing their true impact on your users and business. With a unified dashboard, engineering, QA, and product teams gain the same real-time insights, making it easier to prioritize fixes, validate releases, and align technical work with business outcomes.
Real-time Detection
Instant bug detection and alerting as issues occur in production.
Business Impact Analysis
Understand how technical issues affect user journeys and business metrics.
Minimal Size Impact
Keeps your app lightweight, so users don't face long downloads or storage issues.
Low Memory Usage
Runs efficiently in the background without draining your app's memory.
Smart Prioritization
Automatically prioritize bugs based on their impact on user goals and business outcomes.
Low Bandwidth Usage
Monitors and reports issues without consuming excessive network resources.
Frequently asked questions
Frequently asked questions about Appxiom and its features
Every Bug Costs Users - Catch Them
Before It’s Too Late
Start using Appxiom to detect bugs, report issues, and understand their impact on users and your business - so your team can act smarter and deliver a flawless app experience.