Detect Bugs.
See Their Impact.
Fix Smarter.
Appxiom helps you catch every bug and shows which ones disrupt your users’ journey the most, so you can prioritize what truly matters.
Available on:
Bridge the Gap Between Engineering and Business Impact
Appxiom gives developers, QA teams, and product managers a unified view of every bug and performance issue, helping teams prioritize fixes that improve the user journeys and keep your app running smoothly.
Why it matters: Appxiom provides developers, QA teams, and product managers with a unified view of every bug and performance issue, enabling teams to prioritize fixes effectively and align technical work with business impact.
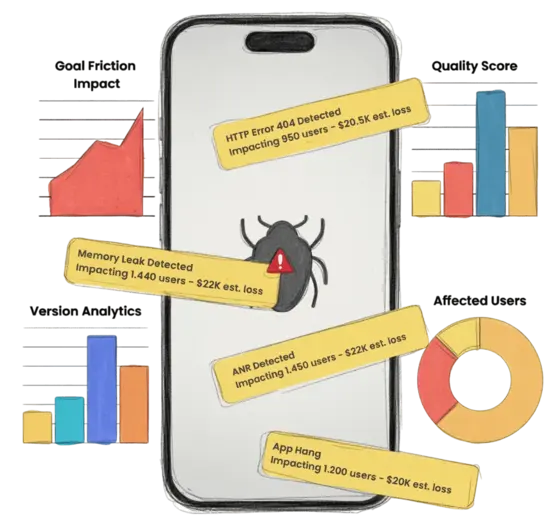
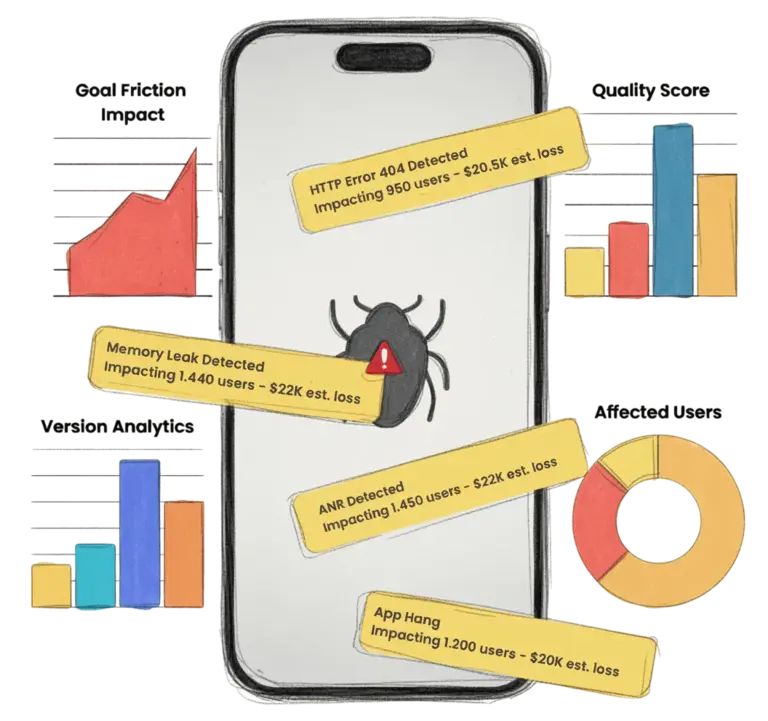
Business Impact Dashboard
Smarter Monitoring for Better Business Outcomes
Detect bugs faster, measure their real-world impact, and fix issues that protect business outcomes.
Real-time Bug Detection
Appxiom is a mobile app monitoring solution that helps you instantly detect bugs and performance issues - all in one application for monitoring app health in real time.
Business Impact Analysis
Track how bugs, and performance issues in apps impact business metrics like revenue, user retention, and customer experience in real time.
Works both online and offline
The Appxiom works both online and offline, capturing app bug reports and performance issue data even when the device has no internet connection.
Seamless Team Collaboration
Integrates with Slack, Jira, and more to simplify workflows, boost productivity, and enhance real-time communication.
Security and Privacy
Multi-layered security with end-to-end encryption and zero PII collection, so your users’ data stays private and protected.
Multi-Platform Support
Fully available on iOS and Android with advanced monitoring features. Web and Flutter platforms launching soon.
Track Every Bug, Understand Its Impact
See all types of issues affecting your app's performance and user experience - so you can act quickly and prioritize what truly matters.
Application Not Responding (ANR)
AndroidFlutter
Application Not Responding (ANR)
AndroidFlutter
App Hang
iOSFlutter
App Hang
iOSFlutter
Memory Leaks
AndroidiOSFlutter
Memory Leaks
AndroidiOSFlutter
Frozen Frames
AndroidiOSFlutter
Frozen Frames
AndroidiOSFlutter
Memory Issues
AndroidiOSFlutter
App Crashes
AndroidiOSFlutter
App Crashes
AndroidiOSFlutter
API Issues
AndroidiOSFlutter
API Issues
AndroidiOSFlutter
Custom Issues
AndroidiOSFlutter
Custom Issues
AndroidiOSFlutter
Memory Issues
AndroidiOSFlutter
Screen Load Delays
AndroidiOS
Screen Load Delays
AndroidiOSFlutter
Smarter Insights to Drive Better Apps
Appxiom combines bug detection with intelligent insights, so you don't just see what's broken - you see how it affects your business.
Goal Friction Impact
Goal Failure Impact
Quality Score
Quality Score
Version Analytics
Version Analytics
Stop Chasing Bugs. Start Protecting Your Business.
Join the shift from “just” bug tracking to business impact - where every fix protects your users and your business.
Join Today
Why Choose Appxiom?
- 30-day free trial, no credit card required
- Setup in under 5 minutes
- 24x7 customer support
- Enterprise-grade security